How much does an environmental-justice map depend on the choices behind it?
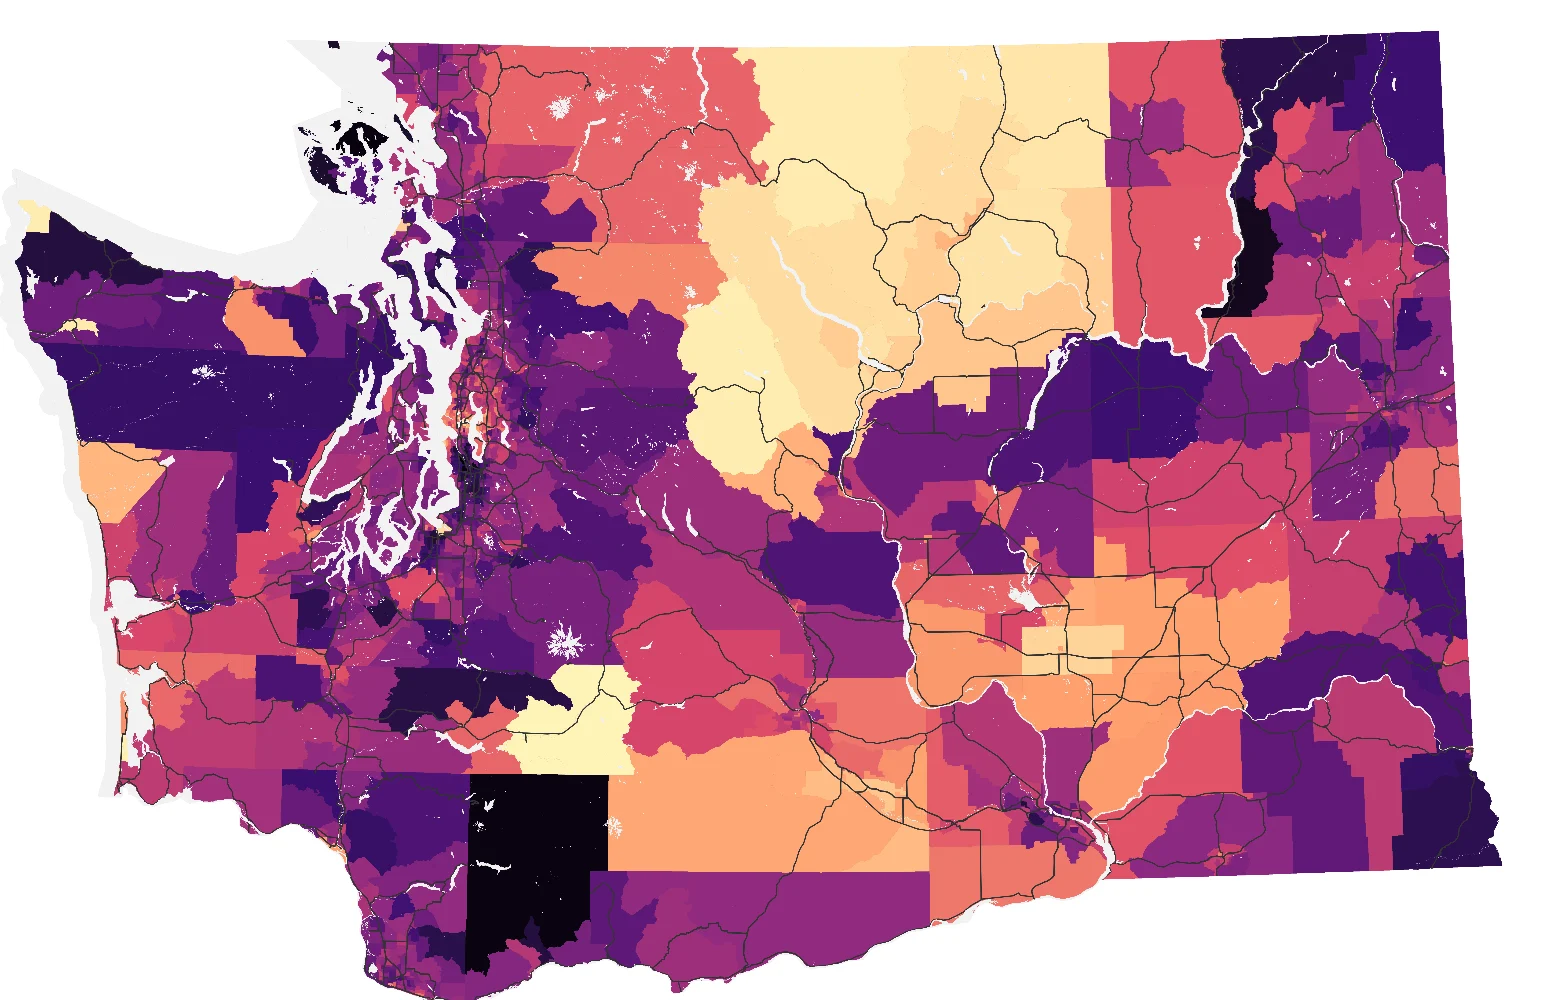
I rebuilt Washington’s Environmental Health Disparities (EHD) Map across 5,000 combinations of seven methodology choices. The analysis measured how those choices moved each census tract’s rank and whether they changed its rank-based “highly impacted” classification.
The index
The Washington Department of Health map combines pollution-burden and population-characteristic indicators into a 1–10 census-tract rank. Under the Clean Energy Transformation Act, tracts ranked 9 or 10 qualify as highly impacted communities. Tracts containing tribal land qualify through a separate criterion. The HEAL Act separately directs covered agencies to consider cumulative environmental-health impacts, using the map or other data where applicable, in environmental-justice assessments. This analysis tested the stability of the ordinal rank and the rank-based 9–10 classification when the index was rebuilt under alternative methods.
Seven methodology levers
A Monte-Carlo, variance-based global (Sobol’) sensitivity analysis, built on a customized fork of the COINr composite-indicator framework. It rebuilds the entire index thousands of times while varying seven methodological levers:
- Indicator selection: dropping one indicator at a time.
- Measurement error: injecting ±25% noise into raw values.
- Normalization: min–max, z-score, percentile, binned decile.
- Weighting: original DOH weights, equal, PCA, inverse-correlation.
- Aggregation formula: arithmetic mean, geometric mean, product, PCA.
- Classification: equal-interval, deciles, z-score.
- Hierarchy: keeping vs. flattening the theme structure.
First- and total-order Sobol’ indices (bootstrapped) quantify how
much each lever drives the result. The headline metric is MARC,
mean absolute rank change: how many ranks the average tract moves,
and how many cross the rank-based 9–10 threshold.
Rank stability
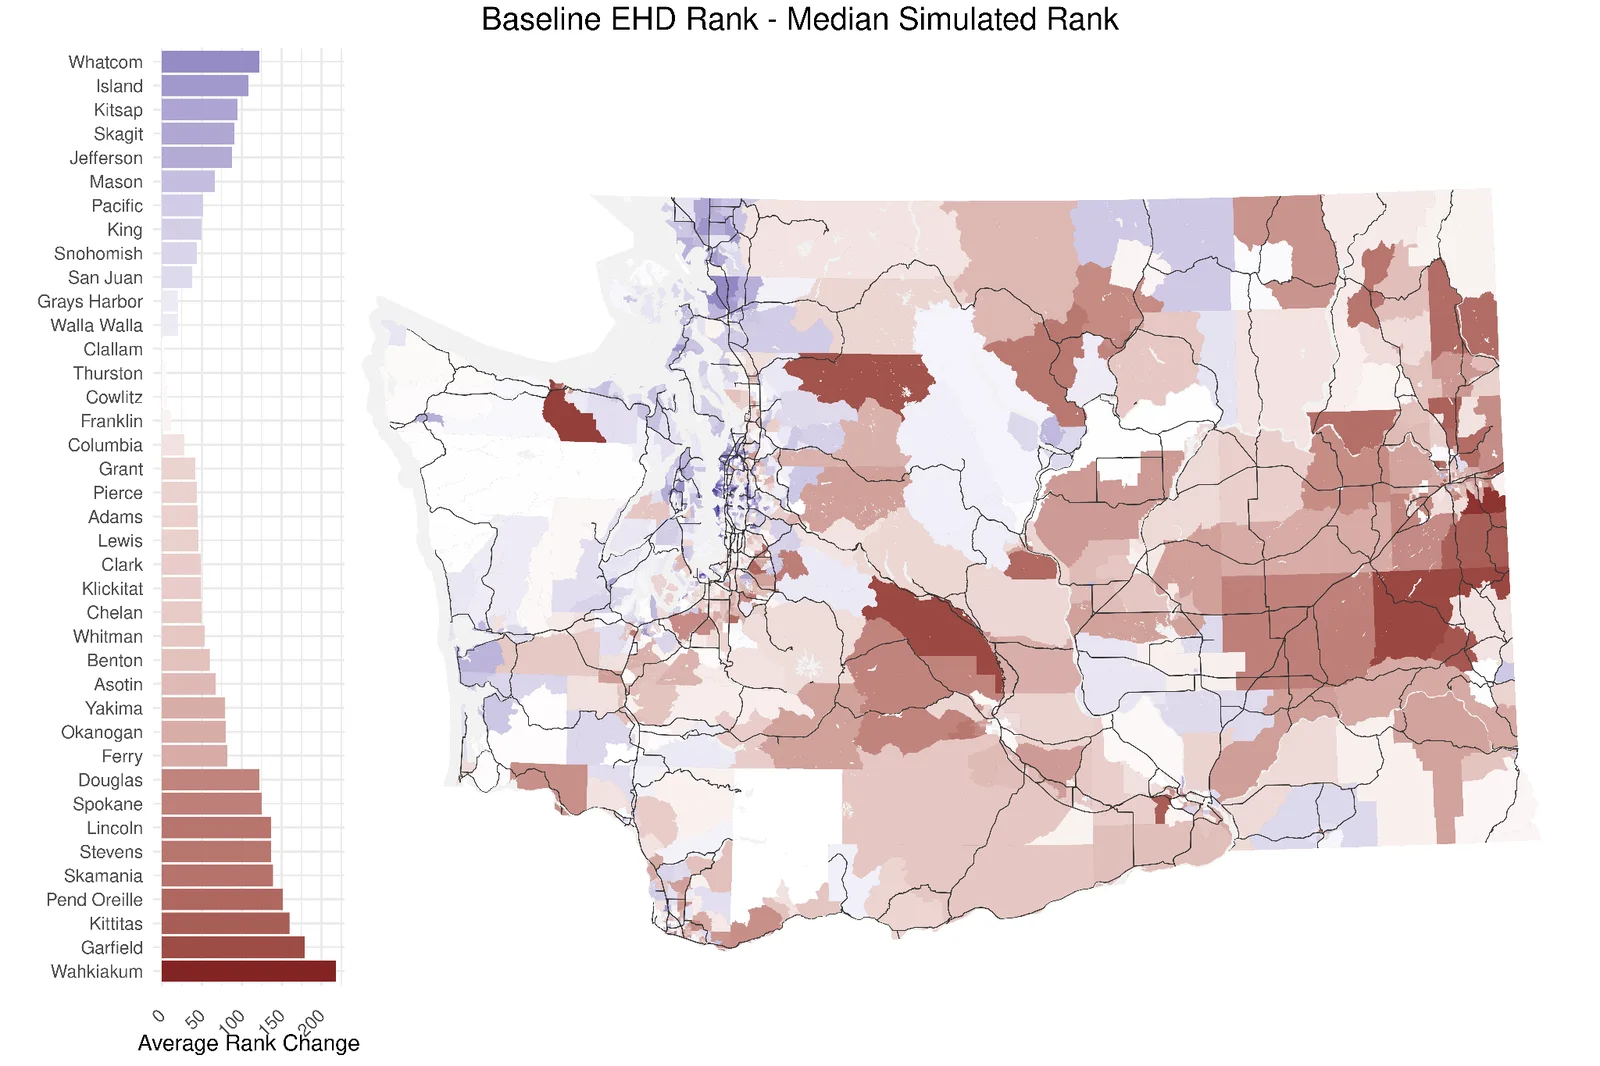
On average, tracts moved more than a hundred ranks across the permutations. The swings were largest in the middle of the impact spectrum and smallest for tracts in the top 10%. The map is far more robust at identifying the most-impacted hotspots than at placing everyone else on an ordinal scale. The aggregation formula and the normalization method were the most consequential choices by a wide margin. In short: the EHD ranking is better suited to classifying hotspots than to fine-grained ranking, and a handful of upstream assumptions substantially drive the result.
The environmental-justice extension
A second analysis tested adding candidate indicators the current map leaves out: asthma, wildfire smoke, pesticide load, and a mortgage-lending-discrimination (redlining) measure, and mapped how ranks shift when they’re included. Historically redlined tracts ranked as more impacted when the discrimination measure was counted. Its omission therefore changes the result.
My role
- The full sensitivity/uncertainty analysis: the seven-lever design, the Sobol’ sampling, and the MARC / impact-flip metrics.
- A faithful reproduction and QA of the official EHD rank calculation from the source data.
- The COINr fork and custom normalizers/aggregators that made the whole index re-runnable under alternative methods.
- A multivariate validation (PCA / PLS against life expectancy) of what drives the index.
- An interactive mapping tool for DOH staff to explore ranks and rank-shifts spatially.