A geospatial seasonality upgrade for malaria models
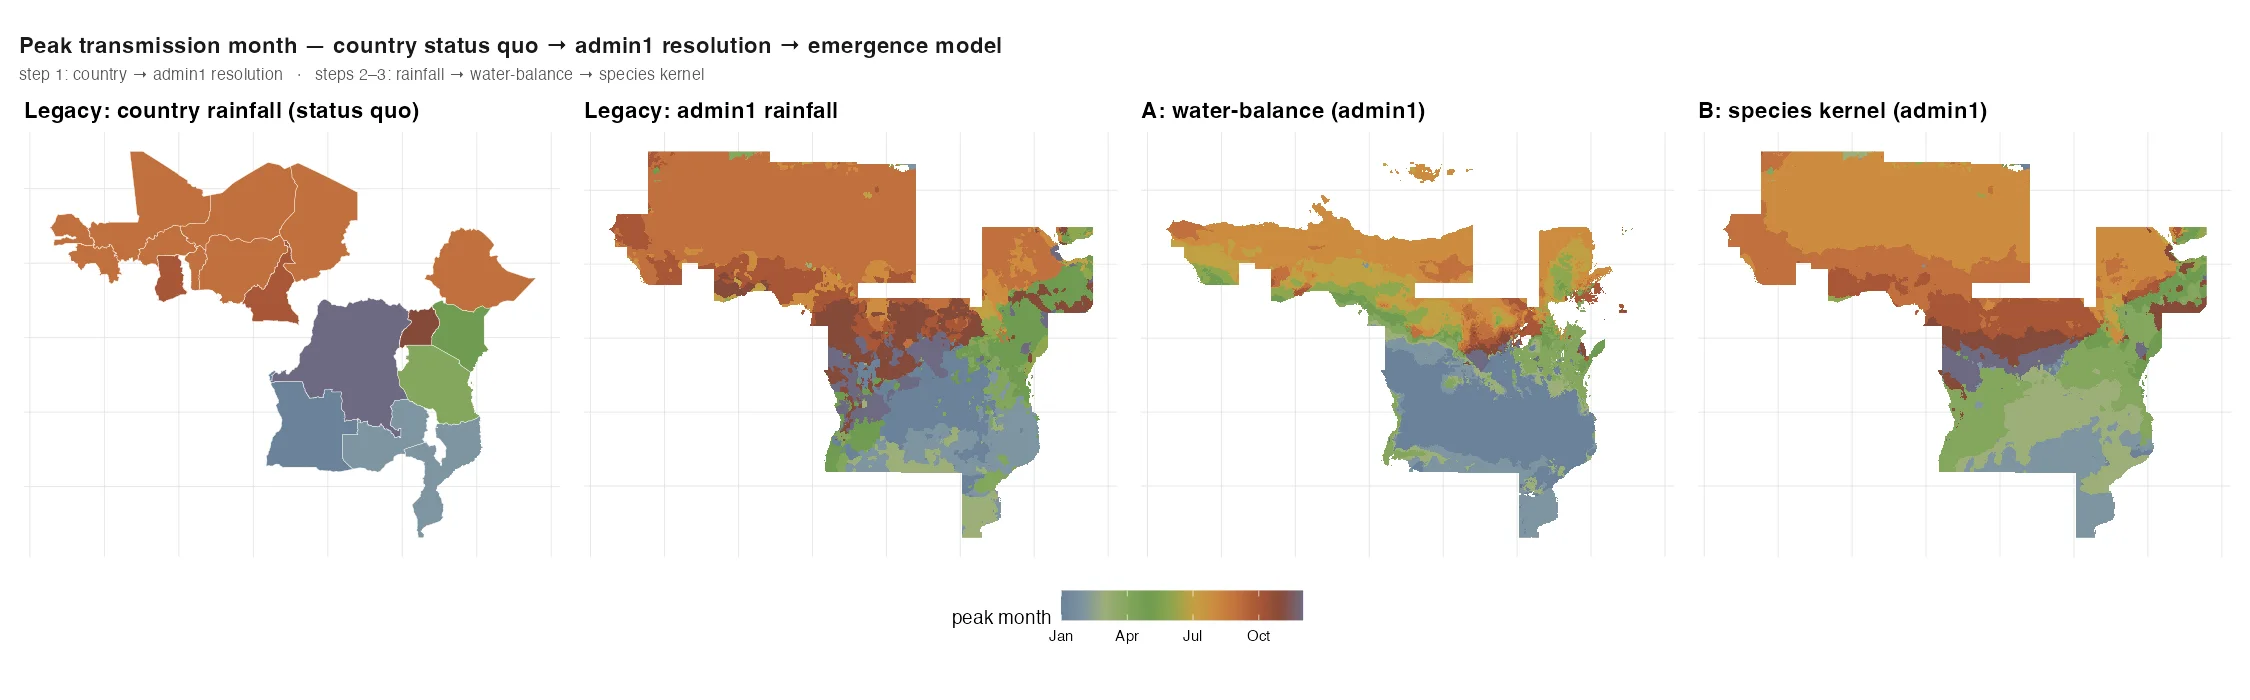
The portfolio used one rainfall curve per country. I rebuilt seasonality as 362 admin1 profiles using water-balance and species-kernel models. The species kernel was tuned against MODIS NDVI phase, and the resulting monthly profiles were exported to OpenMalaria.
The inherited input
Campaign timing and transmission rebound depend on the seasonal profile. Under the national input, a district in the arid north and one on a humid lakeshore received the same transmission calendar. The portfolio needed subnational timing to decide where and when to deploy seasonal products.
Four representations
The upgrade moves seasonality through four representations, from the legacy national curve to a mechanism-based admin1 surface:
- Country rainfall (status quo): one curve per country, the legacy baseline.
- Admin1 rainfall: the same rainfall driver, resolved to sub-national units.
- Water-balance (admin1): a mechanistic soil-moisture / water-balance model, not raw rainfall.
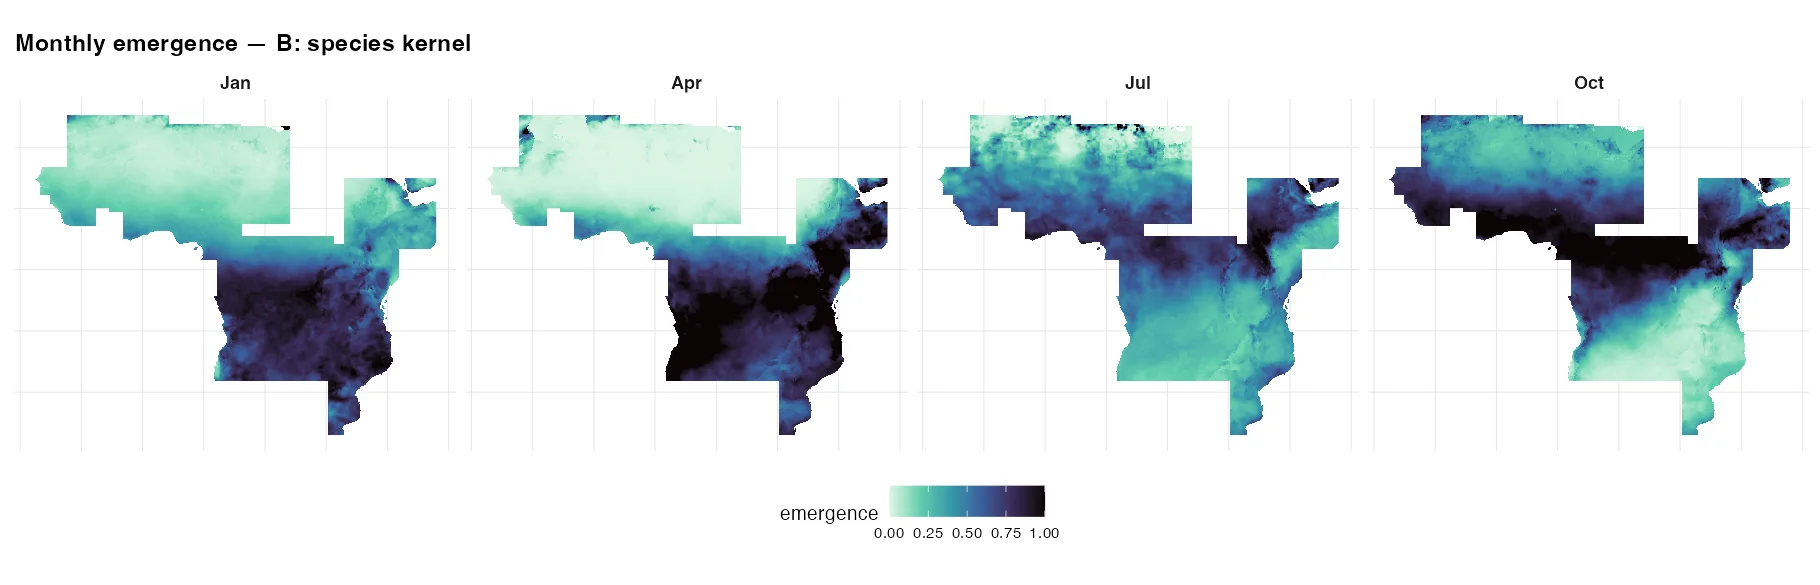
- Species kernel (admin1): a vector-emergence kernel that converts environment into monthly mosquito emergence.
My role
- The full seasonality pipeline, from environmental drivers to per-admin monthly emergence surfaces.
- The water-balance and species-kernel emergence models and their parameterization.
- Calibration of the species kernel against MODIS NDVI phase, with diagnostics for phase correlation, shape error, and peak-month error.
- The OpenMalaria handoff, turning monthly surfaces into simulator-ready seasonality inputs.
- The flyover report itself: a public, reproducible walkthrough of the method and its results.
Handoff
One national curve per country became 362 admin1 emergence profiles, handed to OpenMalaria without touching the simulator. The public flyover shows where peak transmission month moves under each representation, and compares their phase correlation, shape error, and peak-month error against MODIS NDVI.
Public flyover
The full flyover is public: read the seasonality flyover →